
Sprint 7: Análisis estadístico para detectar patrones y outliers#
🥅 Objetivo de la sesión#
Ampliar las tecnicas de manipulación de datos “Data Wrangling” que hemos estudiado hasta ahora con “pandas”.
Convertir columnas a tipo fecha/hora con
pd.to_datetime()y solucionar formatos comunes.Usar el accessor
.dtpara extraer partes de una fecha (año, mes, día, día de semana), redondear y crear features.Identificar valores nulos (qué son y por qué aparecen) y aplicar 3 estrategias: eliminar, imputar, flaggear.
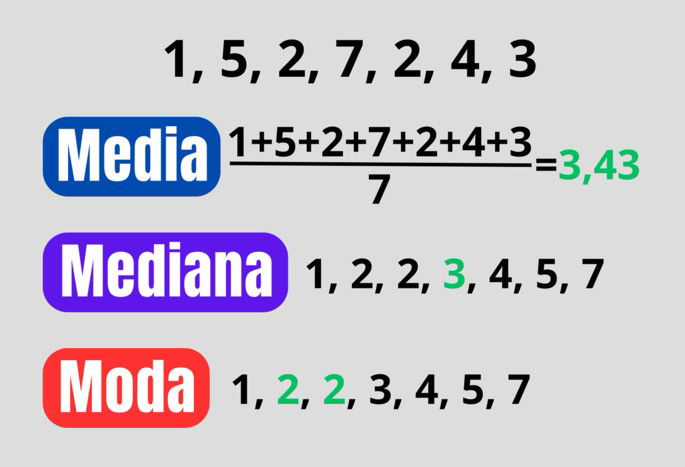
Explicar y calcular media, mediana y moda, e interpretar su comportamiento con datos sesgados y con outliers.
Construir una mini exploración con pandas para dejar datos “listos para análisis”.
🗂️ Agenda de la sesión#
Warm-up: ¿Qué puede salir mal con fechas y nulos? (spoiler: todo)
Fechas en Pandas (35–45 min)
pd.to_datetime()(formatos,errors,dayfirst).dt(componentes, redondeo, periodos, tz)Crear features de calendario
Valores nulos (25–35 min)
Qué es un nulo (NaN / None / NaT)
Detectar nulos
Estrategias: eliminar / imputar / flag
Estadística básica: tendencia central (20–30 min)
Media vs mediana vs moda
Outliers y sesgo (ejemplos e interpretación)
Cierre (5 min): checklist de limpieza + mini quiz
Manejo de fechas en Pandas#
¿Por qué las fechas dan problemas?#
Las fechas suelen venir como
string(texto) con formatos inconsistentes:
2026-01-24,24/01/2026,01-24-26,"January 24, 2026".Puede haber fechas imposibles o corruptas:
2026-13-01,"N/A".A veces hay zonas horarias (
UTC,America/Bogota).
En pandas, cuando una columna es realmente fecha/hora, su tipo es:
datetime64[ns](fecha/hora)datetime64[ns, tz](fecha/hora con zona horaria)NaTpara fecha faltante (Not a Time).
Convertir a fecha: pd.to_datetime()#
Regla de oro: primero conviertes, luego usas
.dt.
Parámetros útiles:
errors='coerce': lo que no pueda convertirse, queda comoNaT(nulo de fecha).dayfirst=True: útil cuando el formato esDD/MM/YYYY.format=...: si conoces el formato exacto, es más rápido y más seguro.utc=True: parsea y convierte a UTC (útil con timestamps de logs).
Formatos comunes (format=):
'%Y-%m-%d'→2026-01-24'%d/%m/%Y'→24/01/2026'%m/%d/%Y'→01/24/2026'%Y-%m-%d %H:%M:%S'→2026-01-24 13:45:10
import pandas as pd
import numpy as np
import matplotlib.pyplot as plt
import seaborn as sns

df = pd.read_csv('https://raw.githubusercontent.com/gbuvoli/Datasets/refs/heads/main/Online_Sales.csv')
display(df.sample(10))
df.info()
| CustomerID | Transaction_ID | Transaction_Date | Product_SKU | Product_Description | Product_Category | Quantity | Avg_Price | Delivery_Charges | Coupon_Status | |
|---|---|---|---|---|---|---|---|---|---|---|
| 49167 | 12836 | 45818 | 12/6/2019 | GGOEGOLC014299 | Google Metallic Notebook Set | Office | 71 | 4.81 | 73.92 | Clicked |
| 25365 | 14527 | 32104 | 7/7/2019 | GGOEGBMJ013399 | Sport Bag | Bags | 1 | 3.99 | 6.00 | Not Used |
| 35955 | 14646 | 37132 | 8/31/2019 | GGOENEBQ078999 | Nest Cam Outdoor Security Camera - USA | Nest-USA | 3 | 119.00 | 6.00 | Not Used |
| 4955 | 12725 | 20006 | 2/8/2019 | GGOEGOAR021999 | Color Changing Grip Pen | Office | 1 | 1.20 | 6.50 | Clicked |
| 5673 | 17062 | 20456 | 2/15/2019 | GGOEGAFB035815 | Google Men's Zip Hoodie | Apparel | 1 | 44.79 | 6.50 | Clicked |
| 29612 | 13656 | 34143 | 7/31/2019 | GGOENEBJ079499 | Nest Learning Thermostat 3rd Gen-USA - Stainle... | Nest-USA | 1 | 149.00 | 12.99 | Clicked |
| 48603 | 13600 | 45407 | 12/2/2019 | GGOEAKDH019899 | Windup Android | Lifestyle | 1 | 4.07 | 6.00 | Not Used |
| 13713 | 16520 | 25656 | 4/15/2019 | GGOENEBJ079499 | Nest Learning Thermostat 3rd Gen-USA - Stainle... | Nest-USA | 2 | 149.00 | 6.00 | Used |
| 4637 | 14911 | 19777 | 2/6/2019 | GGOENEBQ079199 | Nest Protect Smoke + CO White Wired Alarm-USA | Nest-USA | 3 | 79.00 | 6.50 | Clicked |
| 23599 | 14911 | 31066 | 6/23/2019 | GGOEGAAB058914 | Google Men's Short Sleeve Performance Badge Te... | Apparel | 1 | 12.31 | 6.00 | Used |
<class 'pandas.DataFrame'>
RangeIndex: 52924 entries, 0 to 52923
Data columns (total 10 columns):
 #   Column               Non-Null Count  Dtype
---  ------               --------------  -----
 0   CustomerID           52924 non-null  int64
 1   Transaction_ID       52924 non-null  int64
 2   Transaction_Date     52924 non-null  str
 3   Product_SKU          52924 non-null  str
 4   Product_Description  52924 non-null  str
 5   Product_Category     52924 non-null  str
 6   Quantity             52924 non-null  int64
 7   Avg_Price            52924 non-null  float64
 8   Delivery_Charges     52924 non-null  float64
 9   Coupon_Status        52924 non-null  str
dtypes: float64(2), int64(3), str(5)
memory usage: 4.0 MB
#Ajuste de tipos de datos
df['CustomerID'] = df['CustomerID'].astype('object')
df['Transaction_ID'] = df['Transaction_ID'].astype('object')

#Atencion con las fechas
df['Transaction_Date'] = pd.to_datetime(df['Transaction_Date'], errors='coerce', format='%m/%d/%Y')

df.info()
<class 'pandas.DataFrame'>
RangeIndex: 52924 entries, 0 to 52923
Data columns (total 10 columns):
 #   Column               Non-Null Count  Dtype
---  ------               --------------  -----
 0   CustomerID           52924 non-null  object
 1   Transaction_ID       52924 non-null  object
 2   Transaction_Date     52924 non-null  datetime64[us]
 3   Product_SKU          52924 non-null  str
 4   Product_Description  52924 non-null  str
 5   Product_Category     52924 non-null  str
 6   Quantity             52924 non-null  int64
 7   Avg_Price            52924 non-null  float64
 8   Delivery_Charges     52924 non-null  float64
 9   Coupon_Status        52924 non-null  str
dtypes: datetime64[us](1), float64(2), int64(1), object(2), str(4)
memory usage: 4.0+ MB
#Validar cambios en el dataframe
df.head()

#¿Como se ve ahora Transaction_Date?
| CustomerID | Transaction_ID | Transaction_Date | Product_SKU | Product_Description | Product_Category | Quantity | Avg_Price | Delivery_Charges | Coupon_Status | |
|---|---|---|---|---|---|---|---|---|---|---|
| 0 | 17850 | 16679 | 2019-01-01 | GGOENEBJ079499 | Nest Learning Thermostat 3rd Gen-USA - Stainle... | Nest-USA | 1 | 153.71 | 6.5 | Used |
| 1 | 17850 | 16680 | 2019-01-01 | GGOENEBJ079499 | Nest Learning Thermostat 3rd Gen-USA - Stainle... | Nest-USA | 1 | 153.71 | 6.5 | Used |
| 2 | 17850 | 16681 | 2019-01-01 | GGOEGFKQ020399 | Google Laptop and Cell Phone Stickers | Office | 1 | 2.05 | 6.5 | Used |
| 3 | 17850 | 16682 | 2019-01-01 | GGOEGAAB010516 | Google Men's 100% Cotton Short Sleeve Hero Tee... | Apparel | 5 | 17.53 | 6.5 | Not Used |
| 4 | 17850 | 16682 | 2019-01-01 | GGOEGBJL013999 | Google Canvas Tote Natural/Navy | Bags | 1 | 16.50 | 6.5 | Used |
El accessor .dt: tu caja de herramientas#
Una vez tengas una serie datetime (df['fecha']), puedes:
Extraer partes:
.dt.year,.dt.month,.dt.day.dt.day_name(),.dt.month_name().dt.weekday(0=lunes) /.dt.isocalendar().week
Redondear y truncar:
.dt.floor('D')(baja al día).dt.round('H')(redondea a hora)
Diferencias entre fechas:
df['fecha_fin'] - df['fecha_ini']→timedelta.dt.dayspara obtener días
Periodos:
.dt.to_period('M')para agrupar por mes (ej: cohortes / ventas mensuales)
#Explorando las fechas
df['Transaction_Date'].dt.year
df['Transaction_Date'].dt.month
df['Transaction_Date'].dt.month_name()
df['Transaction_Date'].dt.day
df['Transaction_Date'].dt.day_name()
df['Transaction_Date'].dt.hour
df['Transaction_Date'].dt.minute
df['Transaction_Date'].dt.weekday
df['Transaction_Date'].dt.quarter
df['Transaction_Date'].dt.is_month_end
df['Transaction_Date'].dt.is_month_start
df['Transaction_Date'].dt.is_quarter_end
df['Transaction_Date'].dt.is_quarter_start
df['Transaction_Date'].dt.is_year_end
df['Transaction_Date'].dt.is_year_start
df['Transaction_Date'].dt.days_in_month
df['Transaction_Date'].dt.is_leap_year
0        False
1        False
2        False
3        False
4        False
         ...
52919    False
52920    False
52921    False
52922    False
52923    False
Name: Transaction_Date, Length: 52924, dtype: bool
#Creando nuevas columnas a partir de la fecha
df['Year'] = df['Transaction_Date'].dt.year
df['Month'] = df['Transaction_Date'].dt.month_name()
df['Day'] = df['Transaction_Date'].dt.day_name()
df['Quarter'] = df['Transaction_Date'].dt.quarter
df['weekday'] = df['Transaction_Date'].dt.weekday
df['period_month'] = df['Transaction_Date'].dt.to_period('M')
df['period_quarter'] = df['Transaction_Date'].dt.to_period('Q')
df.sample(10)
| CustomerID | Transaction_ID | Transaction_Date | Product_SKU | Product_Description | Product_Category | Quantity | Avg_Price | Delivery_Charges | Coupon_Status | Year | Month | Day | Quarter | weekday | period_month | period_quarter | |
|---|---|---|---|---|---|---|---|---|---|---|---|---|---|---|---|---|---|
| 20960 | 17230 | 29638 | 2019-06-05 | GGOEGAAB010516 | Google Men's 100% Cotton Short Sleeve Hero Tee... | Apparel | 1 | 13.59 | 6.00 | Used | 2019 | June | Wednesday | 2 | 2 | 2019-06 | 2019Q2 |
| 50553 | 16771 | 46735 | 2019-12-13 | GGOENEBD084799 | Nest Learning Thermostat 3rd Gen-USA - Copper | Nest-USA | 2 | 151.88 | 6.50 | Not Used | 2019 | December | Friday | 4 | 4 | 2019-12 | 2019Q4 |
| 32460 | 17811 | 35531 | 2019-08-14 | GGOEYAEA035116 | YouTube Men's Vintage Henley | Apparel | 1 | 15.00 | 6.00 | Clicked | 2019 | August | Wednesday | 3 | 2 | 2019-08 | 2019Q3 |
| 47665 | 14502 | 44699 | 2019-11-27 | GGOEGOLC014299 | Google Metallic Notebook Set | Office | 1 | 5.99 | 6.00 | Used | 2019 | November | Wednesday | 4 | 2 | 2019-11 | 2019Q4 |
| 14277 | 17097 | 25940 | 2019-04-19 | GGOEGDHR018499 | Google 22 oz Water Bottle | Drinkware | 8 | 2.39 | 19.99 | Clicked | 2019 | April | Friday | 2 | 4 | 2019-04 | 2019Q2 |
| 15388 | 14037 | 26550 | 2019-04-27 | GGOEGAPJ058013 | Google Women's 1/4 Zip Jacket Charcoal | Apparel | 1 | 87.99 | 6.00 | Used | 2019 | April | Saturday | 2 | 5 | 2019-04 | 2019Q2 |
| 16144 | 16873 | 27015 | 2019-05-02 | GGOEGAXJ065529 | Google Toddler Short Sleeve T-shirt Grey | Apparel | 1 | 9.51 | 6.00 | Clicked | 2019 | May | Thursday | 2 | 3 | 2019-05 | 2019Q2 |
| 23346 | 16684 | 30932 | 2019-06-21 | GGOEGFKQ020799 | Google Doodle Decal | Office | 1 | 2.39 | 6.50 | Used | 2019 | June | Friday | 2 | 4 | 2019-06 | 2019Q2 |
| 46412 | 13552 | 43687 | 2019-11-17 | GGOEGFKQ020399 | Google Laptop and Cell Phone Stickers | Office | 1 | 2.99 | 6.00 | Not Used | 2019 | November | Sunday | 4 | 6 | 2019-11 | 2019Q4 |
| 20705 | 16145 | 29471 | 2019-06-02 | GGOEGHGC019799 | Google Sunglasses | Lifestyle | 1 | 3.50 | 6.00 | Used | 2019 | June | Sunday | 2 | 6 | 2019-06 | 2019Q2 |
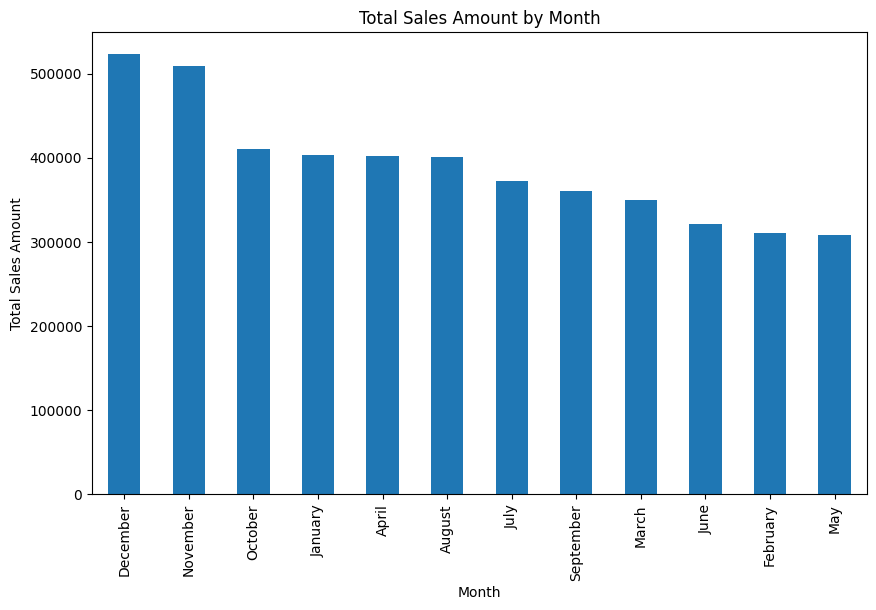
#Ventas por mes
df['sales_amount'] = df['Quantity'] * df['Avg_Price']
df.groupby('Month')['sales_amount'].sum().sort_values(ascending=False).plot(kind='bar', figsize=(10,6))
plt.title('Total Sales Amount by Month')
plt.ylabel('Total Sales Amount')
plt.show()
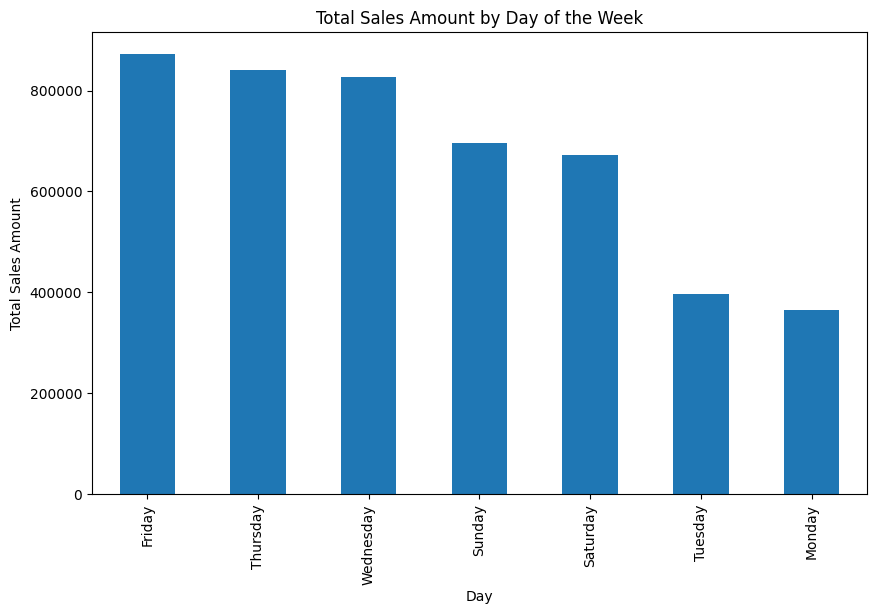
#Ventas por dia de la semana ¿Que dia es mejor para vender?
df.groupby('Day')['sales_amount'].sum().sort_values(ascending=False).plot(kind='bar', figsize=(10,6))
plt.title('Total Sales Amount by Day of the Week')
plt.ylabel('Total Sales Amount')
plt.show()
“Features” de calendario típicos#
year,month,dayday_of_week(0–6)is_weekend(sábado/domingo)hour(si hay hora)month_start,month_endweek(ISO week)season
2) Valores nulos (missing values)#
2.1 ¿Qué es un nulo?#
Es un valor ausente. En pandas puede aparecer como:
NaN(numérico)None(objeto/texto)NaT(fechas)
Causas típicas:
No se recolectó el dato
Error en el proceso (ETL)
Dato no aplica (ej: “edad” para una empresa)
Fallo de parseo (por ejemplo, fecha inválida convertida con
errors='coerce')
2.2 Cómo detectar nulos#
isna()/notna()df.isna().sum()para conteo por columnadf[df['col'].isna()]para ver filas afectadas
## Ejercicio: ¿Cuantos valores nulos hay en el dataset de la tienda de muebles online?

df= pd.read_csv('https://raw.githubusercontent.com/gbuvoli/Datasets/refs/heads/main/online_furniture_retailer.csv')
display(df.head())
df.info()
| product_category | product_subcategory | brand | delivery_status | assembly_service_requested | payment_method | order_id | customer_id | product_price | shipping_cost | assembly_cost | total_amount | delivery_window_days | customer_rating | |
|---|---|---|---|---|---|---|---|---|---|---|---|---|---|---|
| 0 | Outdoor | Patio Set | World Market | Failed Delivery | True | Credit Card | 93810 | 2824 | 191.27 | 45.63 | 86.82 | 323.72 | 11 | 3.2 |
| 1 | Living Room | Sofa | West Elm | Cancelled | True | Apple Pay | 13278 | 5506 | 702.87 | 52.65 | 183.07 | 938.59 | 10 | 4.5 |
| 2 | Dining Room | Bar Stool | Ashley Furniture | Delivered | False | Cash on Delivery | 42098 | 4657 | 395.41 | 96.79 | 0.00 | 492.20 | 2 | NaN |
| 3 | Dining Room | China Cabinet | HomeGoods | Pending | False | Google Pay | 28289 | 2679 | 602.59 | 0.00 | 0.00 | 602.59 | 9 | NaN |
| 4 | Dining Room | China Cabinet | CB2 | Pending | True | Apple Pay | 98696 | 9935 | 1782.36 | 69.23 | 41.53 | 1893.12 | 13 | 1.3 |
<class 'pandas.DataFrame'>
RangeIndex: 1938 entries, 0 to 1937
Data columns (total 14 columns):
 #   Column                      Non-Null Count  Dtype
---  ------                      --------------  -----
 0   product_category            1938 non-null   str
 1   product_subcategory         1938 non-null   str
 2   brand                       1842 non-null   str
 3   delivery_status             1938 non-null   str
 4   assembly_service_requested  1938 non-null   bool
 5   payment_method              1938 non-null   str
 6   order_id                    1938 non-null   int64
 7   customer_id                 1938 non-null   int64
 8   product_price               1938 non-null   float64
 9   shipping_cost               1880 non-null   float64
 10  assembly_cost               1900 non-null   float64
 11  total_amount                1938 non-null   float64
 12  delivery_window_days        1938 non-null   int64
 13  customer_rating             1658 non-null   float64
dtypes: bool(1), float64(5), int64(3), str(5)
memory usage: 198.8 KB
#Cuantos valores nulos hay por columna
df.isnull().sum()
product_category                0
product_subcategory             0
brand                          96
delivery_status                 0
assembly_service_requested      0
payment_method                  0
order_id                        0
customer_id                     0
product_price                   0
shipping_cost                  58
assembly_cost                  38
total_amount                    0
delivery_window_days            0
customer_rating               280
dtype: int64
# Nulos por columna en porcentaje
df.isnull().mean() * 100
product_category               0.000000
product_subcategory            0.000000
brand                          4.953560
delivery_status                0.000000
assembly_service_requested     0.000000
payment_method                 0.000000
order_id                       0.000000
customer_id                    0.000000
product_price                  0.000000
shipping_cost                  2.992776
assembly_cost                  1.960784
total_amount                   0.000000
delivery_window_days           0.000000
customer_rating               14.447884
dtype: float64
2.3 Tres estrategias (y cuándo usarlas)#
A) Eliminar (drop)#
Útil si:
son pocos nulos y no sesgan el análisis
la fila/columna no aporta valor
Riesgo: puedes perder información y sesgar (si los nulos no son aleatorios).
B) Imputar (fill)#
Rellenas nulos con un valor razonable:
Numérico: media/mediana (mediana suele ser más robusta a outliers)
Categórico: moda o “Unknown”
Fechas: un valor de referencia (ojo: esto puede introducir artefactos)
C) Flaggear (crear indicador)#
Creas una columna bandera:
col_was_missing= 1 si faltaba, 0 si no.Útil cuando “faltar” es información valiosa (ej: si no puso teléfono, puede correlacionarse con abandono).
En la vida real, muchas veces haces B + C:
imputas para poder modelar/analizar
y guardas el flag para no perder señal
# Veamoslo gráficamente

sns.heatmap(df.isnull(),yticklabels=False, xticklabels=True)
<Axes: >
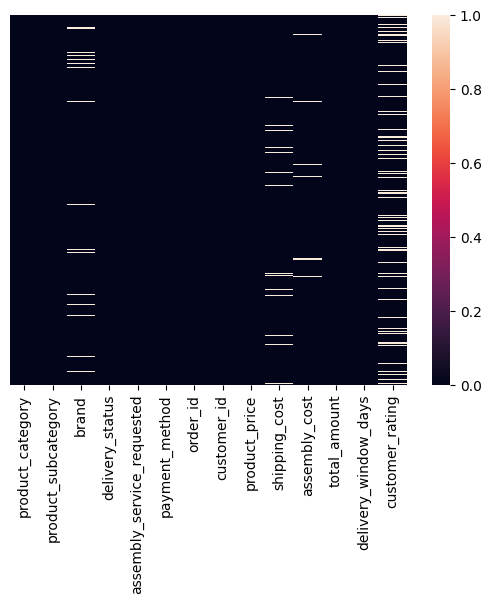
¿Hay algún patrón en los nulos?, ¿Dependencia?, ¿Algúna relación que te ayude a decidir qué hacer con ellos?
#Estudiemos que hacer para cada columna con nulos

df[df['brand'].isnull()]
| product_category | product_subcategory | brand | delivery_status | assembly_service_requested | payment_method | order_id | customer_id | product_price | shipping_cost | assembly_cost | total_amount | delivery_window_days | customer_rating | |
|---|---|---|---|---|---|---|---|---|---|---|---|---|---|---|
| 29 | Office | Bookshelf | NaN | Pending | True | Credit Card | 96673 | 4733 | 142.60 | 50.02 | 116.16 | 308.78 | 8 | 2.7 |
| 65 | Living Room | Armchair | NaN | Pending | True | Google Pay | 79352 | 5119 | 1331.02 | 118.65 | 90.56 | 1540.23 | 5 | NaN |
| 70 | Dining Room | China Cabinet | NaN | Failed Delivery | True | Apple Pay | 24621 | 5808 | 1523.02 | 78.86 | 253.30 | 1855.18 | 12 | 2.1 |
| 99 | Bedroom | Bed Frame | NaN | In Transit | True | Credit Card | 42493 | 4681 | 2854.68 | 59.17 | 26.26 | 2940.11 | 6 | 1.5 |
| 111 | Outdoor | Outdoor Table | NaN | Delivered | True | Apple Pay | 27342 | 8744 | 1431.78 | 58.50 | 57.87 | 1548.15 | 10 | NaN |
| ... | ... | ... | ... | ... | ... | ... | ... | ... | ... | ... | ... | ... | ... | ... |
| 1826 | Kitchen | Pantry Cabinet | NaN | Cancelled | False | Cash on Delivery | 67438 | 7875 | 2135.44 | 0.00 | 0.00 | 2135.44 | 10 | NaN |
| 1865 | Outdoor | Garden Chair | NaN | Rescheduled | False | Bank Transfer | 60793 | 4029 | 596.07 | 119.20 | 0.00 | 715.27 | 2 | 1.5 |
| 1866 | Living Room | TV Stand | NaN | Delivered | True | Bank Transfer | 58630 | 7249 | 2396.69 | 142.22 | 90.27 | 2629.18 | 9 | 5.0 |
| 1869 | Office | Bookshelf | NaN | Cancelled | False | Bank Transfer | 44510 | 8204 | 959.99 | 58.58 | 0.00 | 1018.57 | 1 | NaN |
| 1894 | Kitchen | Pantry Cabinet | NaN | Rescheduled | False | Credit Card | 51910 | 2097 | 1423.40 | 129.01 | 0.00 | 1552.41 | 8 | 1.3 |
96 rows × 14 columns
# Revisemos cardinalidad de brand

print(df['brand'].value_counts())

#Podemos imputar una nueva categoria 'Unknown' para los nulos en brand

df.fillna({'brand':'Unknown'}, inplace=True)

#Validamos
print('Nulos en brand:', df['brand'].isnull().sum())
brand
Overstock           168
HomeGoods           165
World Market        160
CB2                 154
IKEA                154
West Elm            153
Pottery Barn        153
Ashley Furniture    152
Urban Outfitters    149
Crate & Barrel      146
Wayfair             145
Target              143
Name: count, dtype: int64
Nulos en brand: 0
#Estudiemos ahora shipping_cost

df[df['shipping_cost'].isnull()]
| product_category | product_subcategory | brand | delivery_status | assembly_service_requested | payment_method | order_id | customer_id | product_price | shipping_cost | assembly_cost | total_amount | delivery_window_days | customer_rating | |
|---|---|---|---|---|---|---|---|---|---|---|---|---|---|---|
| 5 | Dining Room | Buffet | West Elm | Rescheduled | True | Bank Transfer | 21395 | 7912 | 1307.80 | NaN | 170.18 | 1565.00 | 11 | 3.4 |
| 14 | Outdoor | Lounge Chair | Overstock | In Transit | False | Bank Transfer | 10851 | 3615 | 1712.30 | NaN | 0.00 | 1712.30 | 4 | 4.0 |
| 79 | Living Room | TV Stand | Crate & Barrel | Failed Delivery | False | PayPal | 31174 | 9837 | 1869.92 | NaN | NaN | 1977.91 | 14 | NaN |
| 165 | Bedroom | Dresser | World Market | Cancelled | False | Google Pay | 37938 | 9288 | 1726.69 | NaN | 0.00 | 1726.69 | 13 | 4.3 |
| 214 | Kitchen | Kitchen Cabinet | Target | Pending | True | Bank Transfer | 96511 | 4164 | 418.13 | NaN | 160.52 | 636.43 | 10 | 2.6 |
| 291 | Living Room | Side Table | HomeGoods | Delivered | False | Google Pay | 63424 | 6421 | 202.95 | NaN | 0.00 | 256.90 | 3 | 3.0 |
| 336 | Office | Bookshelf | Ashley Furniture | Delivered | True | Bank Transfer | 50888 | 7149 | 948.13 | NaN | 288.06 | 1374.19 | 2 | 2.8 |
| 338 | Office | Bookshelf | Pottery Barn | In Transit | True | Credit Card | 19961 | 4978 | 1022.47 | NaN | 41.08 | 1128.42 | 3 | 2.9 |
| 408 | Living Room | TV Stand | Target | Delivered | False | Debit Card | 83772 | 5978 | 1031.69 | NaN | 0.00 | 1100.41 | 4 | 4.8 |
| 410 | Kitchen | Bar Cart | Overstock | In Transit | False | Apple Pay | 25525 | 7818 | 2091.22 | NaN | 0.00 | 2221.63 | 14 | 1.6 |
| 432 | Living Room | Side Table | Urban Outfitters | In Transit | False | Credit Card | 44816 | 3330 | 2356.07 | NaN | 0.00 | 2431.40 | 4 | 1.2 |
| 457 | Office | Office Chair | Ashley Furniture | Cancelled | False | Credit Card | 31079 | 6403 | 1392.38 | NaN | 0.00 | 1392.38 | 3 | 4.4 |
| 478 | Office | Computer Table | Wayfair | Delivered | True | Bank Transfer | 82199 | 1224 | 620.46 | NaN | 93.44 | 855.13 | 3 | 1.2 |
| 486 | Dining Room | Bar Stool | World Market | In Transit | True | Bank Transfer | 71894 | 4993 | 1098.24 | NaN | 227.96 | 1411.59 | 11 | 4.2 |
| 579 | Bedroom | Nightstand | Overstock | Failed Delivery | False | Debit Card | 25095 | 8673 | 974.97 | NaN | 0.00 | 1107.25 | 14 | 3.0 |
| 605 | Dining Room | Bar Stool | Urban Outfitters | Delivered | True | Apple Pay | 64935 | 3531 | 216.71 | NaN | 134.89 | 420.88 | 12 | 4.1 |
| 667 | Outdoor | Umbrella | World Market | Rescheduled | True | Cash on Delivery | 72163 | 2099 | 1147.08 | NaN | 269.85 | 1416.93 | 14 | 4.9 |
| 694 | Bedroom | Wardrobe | Crate & Barrel | Failed Delivery | False | Credit Card | 92991 | 1502 | 1820.18 | NaN | 0.00 | 1945.42 | 2 | 2.3 |
| 720 | Living Room | Side Table | Overstock | Failed Delivery | True | Debit Card | 75193 | 8055 | 712.96 | NaN | 74.04 | 787.00 | 13 | 2.3 |
| 825 | Outdoor | Outdoor Table | Pottery Barn | Cancelled | False | Cash on Delivery | 60052 | 9239 | 523.06 | NaN | 0.00 | 602.99 | 3 | 2.1 |
| 831 | Outdoor | Lounge Chair | CB2 | Pending | True | Debit Card | 58655 | 2680 | 477.38 | NaN | 59.43 | 614.79 | 14 | 3.5 |
| 833 | Kitchen | Kitchen Cabinet | HomeGoods | Cancelled | False | Credit Card | 47363 | 2374 | 1840.35 | NaN | 0.00 | 1912.53 | 8 | NaN |
| 871 | Living Room | TV Stand | CB2 | Delivered | False | Cash on Delivery | 18870 | 9618 | 414.39 | NaN | 0.00 | 462.54 | 13 | 2.6 |
| 893 | Dining Room | China Cabinet | Pottery Barn | Cancelled | True | Cash on Delivery | 72049 | 5150 | 1882.01 | NaN | 27.24 | 1969.17 | 1 | 2.6 |
| 917 | Office | Office Chair | Wayfair | Delivered | True | Cash on Delivery | 45986 | 1939 | 1352.08 | NaN | 36.75 | 1442.74 | 14 | 3.9 |
| 938 | Living Room | TV Stand | Target | Failed Delivery | False | Credit Card | 75410 | 9482 | 1777.30 | NaN | 0.00 | 1829.37 | 14 | 5.0 |
| 1001 | Outdoor | Garden Chair | Crate & Barrel | In Transit | False | Bank Transfer | 54589 | 3353 | 1783.39 | NaN | 0.00 | 1783.39 | 7 | 2.6 |
| 1059 | Dining Room | Dining Table | Ashley Furniture | In Transit | False | PayPal | 98317 | 2795 | 1296.00 | NaN | 0.00 | 1346.79 | 8 | 3.6 |
| 1106 | Living Room | Sofa | World Market | Delivered | True | Google Pay | 97796 | 9700 | 1227.26 | NaN | 61.42 | 1363.15 | 12 | 1.2 |
| 1126 | Office | Filing Cabinet | Target | Rescheduled | True | Apple Pay | 69552 | 9901 | 642.76 | NaN | 101.62 | 799.18 | 7 | 4.8 |
| 1137 | Living Room | Armchair | Urban Outfitters | Delivered | True | Credit Card | 66059 | 9442 | 2375.66 | NaN | 281.39 | 2729.99 | 1 | 2.1 |
| 1200 | Living Room | Side Table | Urban Outfitters | Pending | False | Credit Card | 12979 | 5888 | 1792.80 | NaN | 0.00 | 1792.80 | 3 | 1.9 |
| 1263 | Dining Room | China Cabinet | Crate & Barrel | Delivered | True | Google Pay | 50425 | 5285 | 1807.30 | NaN | 76.81 | 1884.11 | 11 | 2.1 |
| 1350 | Kitchen | Kitchen Island | World Market | Pending | False | Credit Card | 21232 | 5839 | 388.95 | NaN | 0.00 | 480.92 | 2 | NaN |
| 1355 | Living Room | Ottoman | Ashley Furniture | Delivered | False | Cash on Delivery | 61068 | 6188 | 2212.83 | NaN | 0.00 | 2212.83 | 3 | NaN |
| 1365 | Living Room | Coffee Table | HomeGoods | Pending | True | Credit Card | 13442 | 2468 | 1737.39 | NaN | 52.03 | 1878.90 | 14 | 2.6 |
| 1401 | Dining Room | Dining Table | Pottery Barn | In Transit | False | Credit Card | 57843 | 2865 | 169.57 | NaN | 0.00 | 195.45 | 2 | 3.6 |
| 1410 | Office | Desk | Target | Delivered | True | Google Pay | 41722 | 5139 | 1256.86 | NaN | 213.73 | 1586.64 | 10 | 2.8 |
| 1422 | Dining Room | Bar Stool | World Market | Rescheduled | True | Google Pay | 31802 | 1725 | 1661.00 | NaN | 40.63 | 1789.16 | 1 | 2.0 |
| 1439 | Living Room | Sofa | IKEA | Rescheduled | True | Debit Card | 37114 | 9537 | 2202.94 | NaN | 122.58 | 2433.02 | 7 | 2.4 |
| 1452 | Kitchen | Pantry Cabinet | CB2 | Delivered | False | Google Pay | 63090 | 4022 | 641.00 | NaN | 0.00 | 736.72 | 1 | 1.7 |
| 1470 | Living Room | Armchair | West Elm | Pending | True | Credit Card | 55603 | 6766 | 1281.92 | NaN | 261.14 | 1543.06 | 8 | 1.7 |
| 1484 | Outdoor | Umbrella | Target | Failed Delivery | True | Apple Pay | 94575 | 3838 | 151.08 | NaN | 105.19 | 329.54 | 5 | 3.7 |
| 1607 | Bedroom | Wardrobe | Crate & Barrel | Cancelled | True | Debit Card | 79243 | 1197 | 974.68 | NaN | 44.65 | 1093.73 | 5 | 4.0 |
| 1623 | Office | Desk | Pottery Barn | Rescheduled | False | Bank Transfer | 80471 | 3501 | 794.40 | NaN | 0.00 | 905.50 | 1 | NaN |
| 1680 | Living Room | Side Table | Target | Failed Delivery | False | Cash on Delivery | 35614 | 9954 | 2119.24 | NaN | 0.00 | 2222.14 | 1 | 3.9 |
| 1681 | Outdoor | Lounge Chair | Overstock | Delivered | False | Bank Transfer | 42129 | 3466 | 1661.63 | NaN | 0.00 | 1738.49 | 13 | 3.3 |
| 1703 | Dining Room | China Cabinet | CB2 | In Transit | False | Bank Transfer | 44208 | 6161 | 1733.11 | NaN | 0.00 | 1830.96 | 8 | 1.5 |
| 1727 | Bedroom | Wardrobe | Wayfair | Failed Delivery | False | PayPal | 69270 | 5093 | 841.01 | NaN | 0.00 | 976.78 | 10 | 1.9 |
| 1762 | Bedroom | Wardrobe | Overstock | In Transit | False | Bank Transfer | 81371 | 8940 | 1055.58 | NaN | 0.00 | 1175.69 | 4 | 2.9 |
| 1788 | Kitchen | Kitchen Cabinet | IKEA | Rescheduled | False | Cash on Delivery | 12612 | 9625 | 438.44 | NaN | 0.00 | 496.28 | 8 | NaN |
| 1825 | Bedroom | Chest of Drawers | Ashley Furniture | Rescheduled | False | Debit Card | 16310 | 7323 | 770.27 | NaN | 0.00 | 770.27 | 13 | 3.1 |
| 1875 | Bedroom | Mattress | World Market | Cancelled | False | Apple Pay | 80968 | 7782 | 2103.71 | NaN | 0.00 | 2103.71 | 12 | 3.7 |
| 1907 | Kitchen | Kitchen Cabinet | Overstock | Pending | True | Credit Card | 44620 | 7275 | 2208.14 | NaN | 97.91 | 2418.92 | 6 | 3.1 |
| 1920 | Dining Room | Dining Chair | Pottery Barn | Failed Delivery | True | PayPal | 99764 | 2609 | 688.73 | NaN | 101.71 | 790.44 | 2 | 2.1 |
| 1930 | Kitchen | Pantry Cabinet | Crate & Barrel | Rescheduled | False | Apple Pay | 18600 | 6097 | 1888.48 | NaN | 0.00 | 1999.22 | 11 | 4.2 |
| 1931 | Kitchen | Bar Cart | Crate & Barrel | Rescheduled | True | Cash on Delivery | 76426 | 7609 | 688.00 | NaN | 100.60 | 916.62 | 13 | NaN |
| 1936 | Living Room | Armchair | Wayfair | In Transit | True | Google Pay | 42701 | 1541 | 2109.30 | NaN | NaN | 2374.30 | 3 | NaN |
#Esto no nos dice mucho, veamos estadísticos descriptivos y hagamos algunas segmentaciones de apoyo para decidir cómo imputar estos nulos

print(df['shipping_cost'].describe())
count    1880.000000
mean       69.622250
std        47.555003
min         0.000000
25%        32.585000
50%        74.055000
75%       107.735000
max       150.000000
Name: shipping_cost, dtype: float64
Observación Podemos ver que el costo de envío promedio es 69.62 con una desviación estándar de 47.55. La mediana es 74.05, lo que indica que la distribución está ligeramente sesgada a la izquierda. El valor mínimo es 0.0 y el máximo es 150, lo que sugiere que hay una amplia gama de costos de envío en el conjunto de datos.
Conclusión La imputación por promedio o mediana quizas no sea la mejor opción.
Analicemos más a fondo.. Quizás por categoría de producto o ventana de entrega
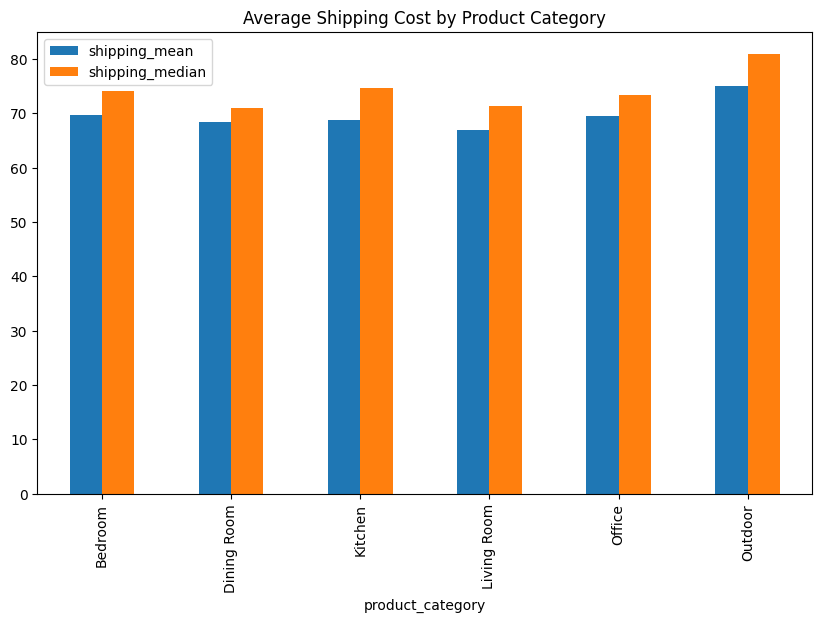
print(
    df.groupby('product_category')
      .agg(shipping_mean=('shipping_cost', 'mean'),
           shipping_median=('shipping_cost', 'median'))
)
df.groupby('product_category').agg(
    shipping_mean=('shipping_cost', 'mean'),
    shipping_median=('shipping_cost', 'median')).plot(kind='bar', figsize=(10,6))
plt.title('Average Shipping Cost by Product Category')
                  shipping_mean  shipping_median
product_category
Bedroom               69.530258           74.080
Dining Room           68.324608           70.910
Kitchen               68.526997           74.590
Living Room           66.743754           71.350
Office                69.455949           73.365
Outdoor               74.808278           80.930
Text(0.5, 1.0, 'Average Shipping Cost by Product Category')

Vemos que las categorías tienen costos de envío promedio y medianos muy cercanos entre sí, excepto outdoor cuyo promedio es 74.8 y mediana es 80.9
Decisión Imputemos los nulos de “Shipping Cost” utilizando la mediana de la categoría a la que pertenece el producto.
# Imputemos los nulos de shipping_cost con la mediana por categoria de producto
medians = df.groupby('product_category')['shipping_cost'].median()

def impute_shipping_cost(row):
    if pd.isnull(row['shipping_cost']):
        return medians[row['product_category']]
    else:
        return row['shipping_cost']

df['shipping_cost'] = df.apply(impute_shipping_cost, axis=1)

#Validamos
print('Nulos en shipping_cost:', df['shipping_cost'].isnull().sum())
Nulos en shipping_cost:
0
#Nuevo grafico por product_category tras la imputacion
df.groupby('product_category').agg(
    shipping_mean=('shipping_cost', 'mean'),
    shipping_median=('shipping_cost', 'median')).plot(kind='bar', figsize=(10,6))
plt.title('Average Shipping Cost by Product Category')
plt.show()
#Estudiemos que hacer para cada columna con nulos

df[df['assembly_cost'].isnull()]
| product_category | product_subcategory | brand | delivery_status | assembly_service_requested | payment_method | order_id | customer_id | product_price | shipping_cost | assembly_cost | total_amount | delivery_window_days | customer_rating | |
|---|---|---|---|---|---|---|---|---|---|---|---|---|---|---|
| 50 | Office | Desk | HomeGoods | Delivered | True | Cash on Delivery | 61856 | 8517 | 151.40 | 53.43 | NaN | 403.86 | 13 | 2.1 |
| 79 | Living Room | TV Stand | Crate & Barrel | Failed Delivery | False | PayPal | 31174 | 9837 | 1869.92 | 71.35 | NaN | 1977.91 | 14 | NaN |
| 101 | Living Room | Coffee Table | Overstock | Failed Delivery | True | Google Pay | 12757 | 4770 | 234.18 | 84.25 | NaN | 420.01 | 5 | NaN |
| 116 | Living Room | Armchair | HomeGoods | Pending | False | Debit Card | 56438 | 7939 | 247.97 | 49.36 | NaN | 297.33 | 14 | 2.4 |
| 130 | Living Room | Armchair | Crate & Barrel | In Transit | False | PayPal | 40982 | 3724 | 1037.89 | 146.96 | NaN | 1184.85 | 13 | 2.8 |
| 167 | Office | Computer Table | World Market | Rescheduled | False | Debit Card | 55745 | 2127 | 137.16 | 27.92 | NaN | 165.08 | 13 | 2.8 |
| 230 | Outdoor | Garden Chair | Overstock | Failed Delivery | False | PayPal | 67154 | 1027 | 724.74 | 128.43 | NaN | 853.17 | 6 | 2.8 |
| 284 | Kitchen | Bar Cart | Ashley Furniture | Pending | False | Debit Card | 40735 | 5451 | 1538.84 | 0.00 | NaN | 1538.84 | 9 | 3.0 |
| 297 | Outdoor | Outdoor Table | Unknown | Failed Delivery | True | PayPal | 72518 | 1096 | 300.38 | 65.81 | NaN | 554.74 | 6 | 1.2 |
| 319 | Office | Office Chair | Urban Outfitters | Failed Delivery | True | Google Pay | 43065 | 2341 | 748.16 | 108.36 | NaN | 1139.93 | 9 | NaN |
| 453 | Dining Room | Buffet | Unknown | Pending | False | Apple Pay | 21959 | 8700 | 381.22 | 50.21 | NaN | 431.43 | 10 | 3.2 |
| 530 | Bedroom | Bed Frame | Wayfair | Failed Delivery | False | Bank Transfer | 16028 | 6314 | 2132.61 | 0.00 | NaN | 2132.61 | 11 | 3.6 |
| 591 | Kitchen | Bar Cart | Crate & Barrel | Cancelled | False | Google Pay | 71797 | 1410 | 706.52 | 59.08 | NaN | 765.60 | 10 | 1.6 |
| 632 | Dining Room | Dining Chair | CB2 | Delivered | False | Google Pay | 87182 | 6304 | 894.83 | 64.59 | NaN | 959.42 | 5 | 2.8 |
| 740 | Living Room | Coffee Table | HomeGoods | Delivered | True | Debit Card | 78676 | 2288 | 439.92 | 66.47 | NaN | 660.42 | 4 | NaN |
| 747 | Bedroom | Nightstand | Target | Failed Delivery | False | Apple Pay | 35415 | 6724 | 1322.14 | 62.12 | NaN | 1384.26 | 2 | 3.0 |
| 764 | Living Room | Coffee Table | CB2 | Failed Delivery | True | Debit Card | 70521 | 8404 | 1563.05 | 143.18 | NaN | 1741.89 | 8 | 3.9 |
| 783 | Office | Desk | Ashley Furniture | Cancelled | True | Apple Pay | 47079 | 7347 | 941.60 | 111.26 | NaN | 1195.65 | 8 | 4.4 |
| 846 | Outdoor | Garden Chair | Wayfair | Pending | True | Google Pay | 95191 | 6493 | 823.77 | 82.46 | NaN | 951.83 | 4 | 2.1 |
| 861 | Living Room | Ottoman | Target | Rescheduled | True | Apple Pay | 18232 | 2816 | 1844.32 | 127.66 | NaN | 2002.86 | 1 | 4.4 |
| 906 | Bedroom | Chest of Drawers | Crate & Barrel | Pending | False | Debit Card | 88964 | 3956 | 1766.79 | 53.15 | NaN | 1819.94 | 6 | 3.5 |
| 907 | Kitchen | Kitchen Cabinet | Unknown | In Transit | True | Credit Card | 81496 | 5813 | 2338.48 | 0.00 | NaN | 2376.43 | 13 | 4.5 |
| 908 | Dining Room | Dining Chair | Target | Cancelled | False | Google Pay | 52101 | 2680 | 517.55 | 143.98 | NaN | 661.53 | 5 | 4.8 |
| 1033 | Outdoor | Umbrella | Wayfair | Cancelled | False | Bank Transfer | 57516 | 5728 | 953.87 | 104.71 | NaN | 1058.58 | 1 | 2.7 |
| 1128 | Living Room | Ottoman | Overstock | In Transit | True | Bank Transfer | 27589 | 9261 | 2321.74 | 149.29 | NaN | 2743.69 | 8 | 4.5 |
| 1198 | Bedroom | Dresser | Urban Outfitters | Delivered | True | Debit Card | 79316 | 3086 | 2765.11 | 65.59 | NaN | 3018.89 | 7 | 3.8 |
| 1273 | Bedroom | Bed Frame | IKEA | Cancelled | True | PayPal | 48691 | 3497 | 1793.77 | 0.00 | NaN | 1964.76 | 12 | 4.2 |
| 1276 | Dining Room | Buffet | Urban Outfitters | Failed Delivery | False | Bank Transfer | 84683 | 5026 | 430.53 | 55.13 | NaN | 485.66 | 6 | 1.6 |
| 1281 | Dining Room | Buffet | CB2 | Cancelled | False | Credit Card | 56160 | 3773 | 1406.82 | 72.58 | NaN | 1479.40 | 3 | 4.6 |
| 1337 | Dining Room | Bar Stool | Crate & Barrel | Cancelled | True | Bank Transfer | 28343 | 2284 | 196.74 | 63.77 | NaN | 524.28 | 7 | 1.1 |
| 1370 | Living Room | Sofa | Pottery Barn | Delivered | False | Credit Card | 60829 | 2387 | 2393.25 | 0.00 | NaN | 2393.25 | 3 | NaN |
| 1502 | Bedroom | Dresser | Ashley Furniture | Delivered | True | Cash on Delivery | 47836 | 3755 | 1211.64 | 0.00 | NaN | 1260.60 | 3 | 4.3 |
| 1513 | Office | Desk | West Elm | Delivered | True | Bank Transfer | 68947 | 5305 | 1436.59 | 129.94 | NaN | 1690.16 | 9 | NaN |
| 1661 | Outdoor | Lounge Chair | Target | In Transit | True | Apple Pay | 14635 | 7870 | 1288.94 | 120.40 | NaN | 1642.74 | 1 | 4.0 |
| 1687 | Living Room | TV Stand | West Elm | Failed Delivery | False | Cash on Delivery | 96154 | 7164 | 321.07 | 75.08 | NaN | 396.15 | 11 | 1.8 |
| 1745 | Office | Desk | World Market | Cancelled | True | Cash on Delivery | 13864 | 7270 | 413.68 | 41.26 | NaN | 483.12 | 5 | 4.8 |
| 1850 | Office | Desk | Overstock | Delivered | True | Credit Card | 48980 | 4891 | 90.40 | 81.85 | NaN | 198.66 | 12 | 3.4 |
| 1936 | Living Room | Armchair | Wayfair | In Transit | True | Google Pay | 42701 | 1541 | 2109.30 | 71.35 | NaN | 2374.30 | 3 | NaN |
Lógica Podríamos pensar que el mismo producto - marca deberían tener el mismo costo de asembly, podríamos buscar referencias que sí tengan dato y usarlo para imputar.
df.groupby(['product_subcategory','brand'])['assembly_cost'].mean().unstack()

#Imputemos los nulos de assembly_cost con la media por subcategoria y marca
means = df.groupby(['product_subcategory','brand'])['assembly_cost'].mean()

#Creamos la función de imputación
def impute_assembly_cost(row):
    if pd.isnull(row['assembly_cost']):
        return means[row['product_subcategory'], row['brand']]
    else:
        return row['assembly_cost']

#Aplicamos la función
df['assembly_cost'] = df.apply(impute_assembly_cost, axis=1)

#Validamos
print('Nulos en assembly_cost:', df['assembly_cost'].isnull().sum())
Nulos en assembly_cost: 0
#Estudiemos que hacer para customer_rating

df[df['customer_rating'].isnull()]
| product_category | product_subcategory | brand | delivery_status | assembly_service_requested | payment_method | order_id | customer_id | product_price | shipping_cost | assembly_cost | total_amount | delivery_window_days | customer_rating | |
|---|---|---|---|---|---|---|---|---|---|---|---|---|---|---|
| 2 | Dining Room | Bar Stool | Ashley Furniture | Delivered | False | Cash on Delivery | 42098 | 4657 | 395.41 | 96.79 | 0.000000 | 492.20 | 2 | NaN |
| 3 | Dining Room | China Cabinet | HomeGoods | Pending | False | Google Pay | 28289 | 2679 | 602.59 | 0.00 | 0.000000 | 602.59 | 9 | NaN |
| 6 | Bedroom | Mattress | IKEA | Delivered | True | Apple Pay | 14165 | 1488 | 1467.44 | 0.00 | 184.290000 | 1651.73 | 13 | NaN |
| 12 | Bedroom | Wardrobe | Target | Delivered | False | Debit Card | 64987 | 4611 | 2867.47 | 141.85 | 0.000000 | 3009.32 | 8 | NaN |
| 13 | Living Room | Coffee Table | Crate & Barrel | In Transit | False | Debit Card | 68878 | 5557 | 2219.42 | 58.57 | 0.000000 | 2277.99 | 14 | NaN |
| ... | ... | ... | ... | ... | ... | ... | ... | ... | ... | ... | ... | ... | ... | ... |
| 1910 | Kitchen | Pantry Cabinet | HomeGoods | Rescheduled | True | Cash on Delivery | 14910 | 3821 | 852.89 | 62.06 | 200.830000 | 1115.78 | 4 | NaN |
| 1915 | Living Room | Side Table | Ashley Furniture | Pending | False | Apple Pay | 16460 | 8785 | 465.51 | 55.49 | 0.000000 | 521.00 | 14 | NaN |
| 1931 | Kitchen | Bar Cart | Crate & Barrel | Rescheduled | True | Cash on Delivery | 76426 | 7609 | 688.00 | 74.59 | 100.600000 | 916.62 | 13 | NaN |
| 1935 | Office | Desk | Ashley Furniture | Pending | True | Cash on Delivery | 36309 | 1944 | 726.73 | 0.00 | 58.770000 | 785.50 | 11 | NaN |
| 1936 | Living Room | Armchair | Wayfair | In Transit | True | Google Pay | 42701 | 1541 | 2109.30 | 71.35 | 132.153333 | 2374.30 | 3 | NaN |
280 rows × 14 columns
#Evaluemos los nulos por grupo de product_subcategory + brand

#Creamos una flag

df['rating_missing'] = df['customer_rating'].isnull().astype(int)

# Asignamos el promedio de rating por grupo por que cualquier otro numero, pero siempre haría los calculos oficiales usando el campo flag.

rating_means = df.groupby(['product_subcategory','brand'])['customer_rating'].mean()

def impute_customer_rating(row):
    if pd.isnull(row['customer_rating']):
        return rating_means[row['product_subcategory'], row['brand']]
    else:
        return row['customer_rating']

df['customer_rating'] = df.apply(impute_customer_rating, axis=1)

#Validamos
print('Nulos en customer_rating:', df['customer_rating'].isnull().sum())
Nulos en customer_rating: 0
Estudiemos este otro caso:#
df=pd.read_csv('https://raw.githubusercontent.com/gbuvoli/Datasets/refs/heads/main/Sales_outbound.csv',skip_blank_lines=True)
display(df.head())
df.info()
| Client_ID | Name | Age | Location | Income | TAX | previous sales_# | Type_of_Products | Contact_Channel | Contact_hour | Num_Contacts | Satisfaction_Score | Sales | |
|---|---|---|---|---|---|---|---|---|---|---|---|---|---|
| 0 | 1 | NaN | 51 | FL | 80000.0 | 12000.0 | 1 | B | 5:30:00 AM | 1 | 4 | 0 | |
| 1 | 2 | NaN | 40 | CA | 82579.0 | 12387.0 | 5 | A | Phone | 4:45:00 PM | 2 | 4 | 1 |
| 2 | 3 | NaN | 25 | NY | 58380.0 | 8757.0 | 3 | C | Online Chat | 6:30:00 AM | 4 | 5 | 1 |
| 3 | 4 | NaN | 57 | IL | 75000.0 | 11250.0 | 0 | A | 5:30:00 AM | 3 | 2 | 0 | |
| 4 | 5 | NaN | 61 | CA | 50049.0 | 7507.0 | 0 | B | 9:00:00 AM | 1 | 4 | 0 |
<class 'pandas.DataFrame'>
RangeIndex: 1000 entries, 0 to 999
Data columns (total 13 columns):
 #   Column              Non-Null Count  Dtype
---  ------              --------------  -----
 0   Client_ID           1000 non-null   int64
 1   Name                0 non-null      float64
 2   Age                 1000 non-null   int64
 3   Location            1000 non-null   str
 4   Income              996 non-null    float64
 5   TAX                 996 non-null    float64
 6   previous sales_#    1000 non-null   int64
 7   Type_of_Products    1000 non-null   str
 8   Contact_Channel     1000 non-null   str
 9   Contact_hour        1000 non-null   str
 10  Num_Contacts        1000 non-null   int64
 11  Satisfaction_Score  1000 non-null   int64
 12  Sales               1000 non-null   int64
dtypes: float64(3), int64(6), str(4)
memory usage: 101.7 KB
#Nulos por columna
df.isna().sum()
Client_ID                0
Name                  1000
Age                      0
Location                 0
Income                   4
TAX                      4
previous sales_#         0
Type_of_Products         0
Contact_Channel          0
Contact_hour             0
Num_Contacts             0
Satisfaction_Score       0
Sales                    0
dtype: int64
Observaciones
La Columna name esta nula completamente.
Solo hay 4 nulos en income y tax.
#Inspección gráfica de nulos
sns.heatmap(df.isnull(), yticklabels=False, xticklabels=True)
<Axes: >
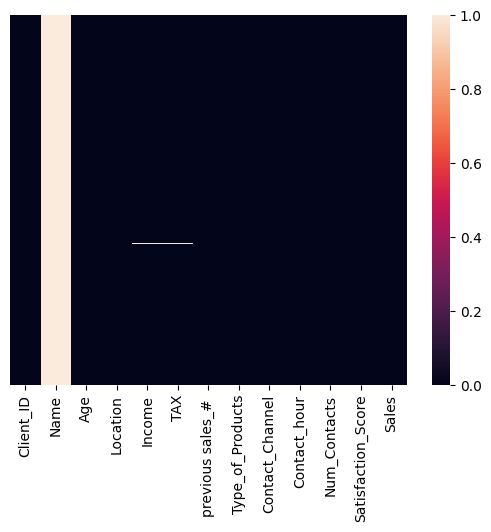
Observaciones
Los nulos de incomeson los mismos de tax
No hay forma de inferir esta información. Es mas seguro, eliminarla.
La columna
Namees irrelevante para nuestro análisis.
# Procedemos a eliminar las filas con nulos en *Income* y *TAX* ya que son pocas y no podemos imputar valores razonables
df.dropna(subset=['Income', 'TAX'], inplace=True)

#Eliminamos la columna *Name* que no aporta valor analítico
df.drop(columns=['Name'], inplace=True)

#Validamos
df.info()
<class 'pandas.DataFrame'>
Index: 996 entries, 0 to 999
Data columns (total 12 columns):
 #   Column              Non-Null Count  Dtype
---  ------              --------------  -----
 0   Client_ID           996 non-null    int64
 1   Age                 996 non-null    int64
 2   Location            996 non-null    str
 3   Income              996 non-null    float64
 4   TAX                 996 non-null    float64
 5   previous sales_#    996 non-null    int64
 6   Type_of_Products    996 non-null    str
 7   Contact_Channel     996 non-null    str
 8   Contact_hour        996 non-null    str
 9   Num_Contacts        996 non-null    int64
 10  Satisfaction_Score  996 non-null    int64
 11  Sales               996 non-null    int64
dtypes: float64(2), int64(6), str(4)
memory usage: 101.2 KB
RESUMEN:#
El manejo de nulos depende exclusivamente del contexto de los datos:
De maneja general los datos ausentes se puede clasificar en:
MCAR: Missing Completely at Random
MAR: Missing at Random
MNAR: Missing Not at Random
Estadística básica: medidas de tendencia central#
3.1 Media (promedio)#
Suma de valores / número de valores.
Sensibles a outliers: un valor extremo la puede disparar.
Buena para distribuciones “simétricas”.
3.2 Mediana#
Valor central al ordenar.
Robusta a outliers.
Muy usada en ingresos/precios (donde hay colas largas).
3.3 Moda#
Valor más frecuente.
Útil con variables categóricas o discretas.
# =========================
# 1) Dataset simple (sin outliers)
# =========================
data_simple = [10, 12, 12, 13, 15, 16, 18]
s1 = pd.Series(data_simple, name="simple")

print("=== Dataset simple ===")
print("Datos:", data_simple)
print("Media  :", s1.mean())
print("Mediana:", s1.median())
print("Moda   :", list(s1.mode()))  # puede devolver varias modas

# =========================
# 2) Dataset con outlier (para ver el efecto en la media)
# =========================
data_outlier = [10, 12, 12, 13, 15, 16, 100]  # 100 es un outlier
s2 = pd.Series(data_outlier, name="outlier")

print("\n=== Dataset con outlier ===")
print("Datos:", data_outlier)
print("Media  :", s2.mean())
print("Mediana:", s2.median())
print("Moda   :", list(s2.mode()))


# =========================
# 3) Ejemplo con datos categóricos (moda como 'más frecuente')
# =========================
channels = ["web", "app", "web", "store", "web", "app", "web"]
s3 = pd.Series(channels, name="channel")

print("\n=== Categórico (moda) ===")
print("Datos:", channels)
print("Moda:", list(s3.mode()))  # aquí la moda tiene mucho sentido

print("\nConteo por categoría:")
print(s3.value_counts())


# =========================
# 4) Caso extra: cuando hay más de una moda (bimodal)
# =========================
data_bimodal = [1, 1, 2, 2, 3, 4, 5]
s4 = pd.Series(data_bimodal, name="bimodal")

print("\n=== Dataset bimodal (dos modas) ===")
print("Datos:", data_bimodal)
print("Media  :", s4.mean())
print("Mediana:", s4.median())
print("Moda   :", list(s4.mode()))
=== Dataset simple ===
Datos: [10, 12, 12, 13, 15, 16, 18]
Media  : 13.714285714285714
Mediana: 13.0
Moda   : [12]

=== Dataset con outlier ===
Datos: [10, 12, 12, 13, 15, 16, 100]
Media  : 25.428571428571427
Mediana: 13.0
Moda   : [12]

=== Categórico (moda) ===
Datos: ['web', 'app', 'web', 'store', 'web', 'app', 'web']
Moda: ['web']

Conteo por categoría:
channel
web      4
app      2
store    1
Name: count, dtype: int64

=== Dataset bimodal (dos modas) ===
Datos: [1, 1, 2, 2, 3, 4, 5]
Media  : 2.5714285714285716
Mediana: 2.0
Moda   : [1, 2]
¿Qué aprendimos hoy? 🧠#
Manejo de fechas Considera si necesitas transformar (Si tu análisis tiene dimensión temporal.) Utiliza
pd.todatetime()primero, y luego el accesor.dtpara manipular.Nulos:
NaN,NoneyNaTsignifican “dato ausente”, y puede ser por fallas de captura, no-aplica, o parsing. Antes de actuar, mide cuántos hay y en qué columnas.Estrategias de manejo de nulos, ninguna es “la correcta” en automático.
Eliminar cuando son pocos y no sesgan.
Imputar cuando necesitas completar para análisis/modelos.
Flaggear cuando “estar ausente” podría explicar comportamiento (y muchas veces conviene combinar imputar + flag).
Media y mediana cuentan historias distintas.
La media es sensible a outliers (puede inflarse con un valor extremo).
La mediana es más robusta y suele representar mejor el “típico” cuando hay colas largas (ingresos, precios, revenue).
Próxima clase ⏭️: Habilidades técnicas Python:#
Blucles
Funciones
Estructuras condicionales
Aplicaciones en limpieza de dataframes
Sesión Práctica 💪: Habilidades técnicas python#
🎯 Objetivos de la sesión#
Al final de esta clase podrás:
Explicar qué son funciones, condicionales (
if/elif/else) y bucles (for,while) y cuándo conviene usarlos.Escribir funciones simples para tareas típicas de limpieza (normalización, validación, categorización).
Aplicar condicionales para reglas de negocio
Iterar sobre listas/columnas/diccionarios para automatizar limpieza repetitiva.
Comparar enfoque “manual repetitivo” vs “función reutilizable”.
🧭 Agenda#
Contexto: por qué Python “puro” importa aunque uses pandas.
Condicionales:
if,elif,elsevalidación y reglas de limpieza
Bucles:
forsobre listas/dictswhilepara procesos repetidos (con cuidado)
Funciones:
def, parámetros,returnfunciones para limpieza y calidad de datos
Mini taller (15–20 min): pipeline simple: limpiar + validar + generar flags
Un poquito de teoría#
Condicionales (if / elif / else)#
Sirven para tomar decisiones: ejecutar un bloque u otro dependiendo de una condición booleana (True/False).
Estructura:
if: primera condiciónelif: condiciones alternativas (opcional, puede haber varias)else: caso por defecto (opcional)
Uso típico en limpieza:
“Si es nulo → imputo”
“Si el string tiene espacios → recorto”
“Si no cumple formato → marco como inválido”

Bucles (for y while)#
Sirven para repetir acciones.
for#
Itera sobre elementos de una colección: listas, diccionarios, rangos, etc.
Uso típico en limpieza:
aplicar una regla a una lista de columnas
recorrer registros y construir resultados
evaluar múltiples condiciones o validaciones
while#
Repite mientras una condición se cumpla.
Advertencia: si no cambias la condición, haces un loop infinito (y el notebook se frita).
Uso típico en limpieza:
reintentar un proceso hasta que cumpla una condición
limpiar repetidamente hasta estabilizar (ej.: quitar espacios dobles hasta que no existan)
Funciones#
Una función es una pieza de código reutilizable que recibe entradas (parámetros) y devuelve una salida (return).
Por qué importa en limpieza:
Evita copiar/pegar lógica (el enemigo #1 de la consistencia)
Te permite aplicar reglas de forma uniforme
Facilita pruebas: “si entra X, debe salir Y”
PRÁCTICA#
Los bucles for Se utilizan cuando tienes un bloque de codigo que quieres repetir un numero determinado de veces o quieres recorrer un elemento iterable
# Imprimir números del 1 al 5

for i in [1, 2, 3, 4, 5]:
    print(i)
1
2
3
4
5
# Imprimen cada letra de la frase "Hello world" un mensaje indicando el inicio y fin del ciclo
phrase="Hello world"
for letter in phrase:
  print('--inicia el ciclo, letter =', letter)
  print(' Aquí agregas cualquier operacion que quieras hacer')
  print('--fin del ciclo-------\n')
--inicia el ciclo, letter = H
 Aquí agregas cualquier operacion que quieras hacer
--fin del ciclo-------

--inicia el ciclo, letter = e
 Aquí agregas cualquier operacion que quieras hacer
--fin del ciclo-------

--inicia el ciclo, letter = l
 Aquí agregas cualquier operacion que quieras hacer
--fin del ciclo-------

--inicia el ciclo, letter = l
 Aquí agregas cualquier operacion que quieras hacer
--fin del ciclo-------

--inicia el ciclo, letter = o
 Aquí agregas cualquier operacion que quieras hacer
--fin del ciclo-------

--inicia el ciclo, letter =
 Aquí agregas cualquier operacion que quieras hacer
--fin del ciclo-------

--inicia el ciclo, letter = w
 Aquí agregas cualquier operacion que quieras hacer
--fin del ciclo-------

--inicia el ciclo, letter = o
 Aquí agregas cualquier operacion que quieras hacer
--fin del ciclo-------

--inicia el ciclo, letter = r
 Aquí agregas cualquier operacion que quieras hacer
--fin del ciclo-------

--inicia el ciclo, letter = l
 Aquí agregas cualquier operacion que quieras hacer
--fin del ciclo-------

--inicia el ciclo, letter = d
 Aquí agregas cualquier operacion que quieras hacer
--fin del ciclo-------
# Saluda a los estudiantes de la siguiente lista
students = ["Ana", "Luis", "María", "Carlos", "Sofía"]
for student in students:
    print(f"Hola, {student}!")
Hola, Ana!
Hola, Luis!
Hola, María!
Hola, Carlos!
Hola, Sofía!
# Cambia a mayusculas los nombres de las columnas del dataframe
El ciclo while en Python permite ejecutar un bloque de código repetidamente mientras se cumpla una condición.
contador = 0  # Variable de inicio

while contador < 5:  # Se ejecuta mientras el contador sea menor o igual a 5
    print("Inicia el ciclo, contador es:", contador)
    contador += 1  # Incremento para evitar un bucle infinito
    print("Termina el ciclo, contador es:", contador)
    print("---------------------------------")
Inicia el ciclo, contador es: 0
Termina el ciclo, contador es: 1
---------------------------------
Inicia el ciclo, contador es: 1
Termina el ciclo, contador es: 2
---------------------------------
Inicia el ciclo, contador es: 2
Termina el ciclo, contador es: 3
---------------------------------
Inicia el ciclo, contador es: 3
Termina el ciclo, contador es: 4
---------------------------------
Inicia el ciclo, contador es: 4
Termina el ciclo, contador es: 5
---------------------------------
# Contar de 1 a 5
i = 1
while i <= 5:
    print(i)
    i = i + 1
1
2
3
4
5
# Restar 1 hasta llegar a 0
x = 3
while x > 0:
    print("x =", x)
    x = x - 1
print("Listo, llegó a 0")
x = 3
x = 2
x = 1
Listo, llegó a 0
# Sumar hasta pasar 10
total = 0
i = 1
while total <= 10:
    total = total + i
    i = i + 1
print("Total final:", total)
Total final: 15
edad = int(input("Ingrese su edad: "))

while edad <= 18:  # Se ejecuta mientras la edad sea inválida
    print(" Ud no tiene la edad autorizada para ingresar.")
    edad = int(input("Ingrese nuevamente su edad: "))

print("Edad registrada:", edad)
---------------------------------------------------------------------------
StdinNotImplementedError                  Traceback (most recent call last)
Cell In[35], line 1
----> 1 edad = int(input("Ingrese su edad: "))
      3 while edad <= 18:  # Se ejecuta mientras la edad sea inválida
      4     print(" Ud no tiene la edad autorizada para ingresar.")

File /opt/hostedtoolcache/Python/3.11.15/x64/lib/python3.11/site-packages/ipykernel/kernelbase.py:1402, in Kernel.raw_input(self, prompt)
   1400 if not self._allow_stdin:
   1401     msg = "raw_input was called, but this frontend does not support input requests."
-> 1402     raise StdinNotImplementedError(msg)
   1403 return self._input_request(
   1404     str(prompt),
   1405     self._get_shell_context_var(self._shell_parent_ident),
   1406     self.get_parent("shell"),
   1407     password=False,
   1408 )

StdinNotImplementedError: raw_input was called, but this frontend does not support input requests.
Condicionales if/elif/ else te permiten definir reglas para controlar la ejecución de tareas
# IF-ELIF-ELSE 1) Nota: A/B/C/D
score = 73
if score >= 90:
    print("A")
elif score >= 80:
    print("B")
elif score >= 70:
    print("C")
else:
    print("D")
# IF-ELIF-ELSE 2) Clasificar temperatura
temp = 30
if temp < 10:
    print("frío")
elif temp < 25:
    print("templado")
else:
    print("caliente")
edad = int(input("Ingrese su edad: "))
estatura = float(input("Ingrese su estatura: "))

if edad >= 18: # if + condición + :
    print("Eres mayor de edad.") #Atención a la identación
    if estatura >= 1.80:
        print("Eres alto.")
    else:
        print("Eres bajo.")

elif edad >=13:
    print("Eres un adolescente.")

else: # No lleva condición porque es la "alternativa" al if
    print("Eres menor de edad.")
Las funciones son como “recetas de cocina”, evita que repitas procesos y te ayuda a mantener la consistencia
# Saludar
def greet(name):
    print("Hola", name)

greet("Gina")
# FUNC 2) Sumar dos números
def add(a, b):
    return a + b

print("Suma:", add(2, 3))
 #Par o impar
def is_even(x):
    return x % 2 == 0

print("Es par?", is_even(10))
¿Como podriamos combinar todo esto para limpiar datos?
Crea funciones para: Explorar y limpiar datasets
def convertir_columnas_numericas(df, columnas):
    for col in columnas:
        df[col] = pd.to_numeric(df[col], errors="coerce")
    return df
RETO Crea una funcion que:
seleccione las columnas numericas, calcule el porcentaje de nulos, y elimine las columnas con mas del 70%.
Si tiene menos del 5%, elimine las filas con nulos.
De lo contrario, impute con la mediana.
¿Qué aprendimos hoy? 🧠#
Condicionales (
if/elif/else) permiten definir reglas.Bucles (
for, while) sirven para automatizar tareas repetitivas:forpara recorrer colecciones (campos, columnas, reglas).whilepara limpiar hasta cumplir una condición (usarlo con cuidado).
Funciones convierten cualquier tarea en un sistema reutilizable
Integración con pandas: puedes construir funciones en Python puro y aplicarlas a un dataframe con
.apply()
Próxima Semana ⏭️:#
Análisis de distribuciones e histogramas
Detección de outliers con el metodo de IQR y z-score
Manipulación de outliers
Segmentación de clientes con funciones y condicionales.
GitHub